Mastering AI-Driven Productivity: A 2026 Guide to Agentic Workflows and Visual Analytics
By Abo-Elmakarem Shohoud | Ailigent
Introduction: The Productivity Paradigm of Late 2026
Unlocking Peak Performance: How to Master Google Workspace's Evolving AI and Mobile Tools
Source: Dev.to AI
As we navigate the final quarter of 2026, the definition of "enterprise productivity" has shifted from manual oversight to autonomous orchestration. For business owners and tech leaders, the challenge is no longer about finding tools that perform tasks, but about building ecosystems where AI functions as a proactive collaborator. In this tutorial, we will explore how to integrate the latest advancements in Google Workspace AI, autonomous agents like PayScope, and modern visualization frameworks like shadcn/ui to create a high-performance business environment.
At Ailigent, led by Abo-Elmakarem Shohoud, we have observed that the most successful organizations in 2026 are those that move beyond simple chatbots toward "Agentic AI."
Agentic AI is a paradigm where AI systems operate as autonomous entities capable of planning, executing multi-step tasks, and making decisions based on complex contexts like legal terms or project constraints.
Learning Objectives
By the end of this guide, you will be able to:
- Leverage proactive AI tools in Google Workspace for 2026 workflows.
- Implement autonomous agents to analyze complex terms and conditions (The PayScope Model).
- Build high-performance data visualizations in Next.js using shadcn/ui charts without boilerplate.
- Orchestrate these technologies into a unified business dashboard.
Section 1: The Evolution of Workspace AI in 2026
In 2026, Google Workspace has evolved beyond simple text generation. It now offers proactive collaboration. Instead of asking a bot to "summarize this email," the 2026 AI agent monitors your project milestones and automatically flags potential delays based on cross-app data.
Key Features of 2026 AI Workspaces:
- Cross-App Contextual Awareness: The AI understands that a comment in a Google Doc relates to a specific line item in a Google Sheet and a deadline in your Calendar.
- Mobile-First Agentic Actions: Mobile tools now allow for voice-commanded complex workflows, such as "Reconcile this month's invoices against the project contract and highlight discrepancies."
| Feature | 2024 Capability | 2026 Capability (Current) |
|---|---|---|
| Automation | Trigger-based (If This Then That) | Goal-based (Agentic Reasoning) |
| Data Analysis | Static charts from tables | Dynamic, natural language visualization |
| Contract Review | Keyword searching | Semantic term analysis and risk scoring |
| Collaboration | Human-to-Human with AI help | Human-to-Agent-to-Human |
Section 2: Building the Intelligence Layer with Autonomous Agents
One of the most exciting developments this year is the rise of specialized agents like PayScope. These are not just LLMs; they are reasoning engines designed to protect business interests by reading the "fine print."
Concept: The "Terms-First" Agent
Imagine an agent that doesn't just see a project status as "Open" but reads the underlying legal documentation to see if the submission window is actually closed or if there are hidden costs (like refundable bonds). This level of granular analysis is what separates 2026 automation from the rudimentary scripts of the past.
Step-by-Step: Implementing a Logic-Gated Agent
- Define the Objective: The agent must evaluate a potential partnership or bounty.
- Context Retrieval: Use RAG (Retrieval-Augmented Generation) to pull the full text of terms and conditions.
- Logic Gating: Instead of a summary, ask the agent to output a JSON object with specific fields:
is_eligible,hidden_costs,deadline_validated.
Section 3: Visualizing Insights with shadcn/ui and Next.js
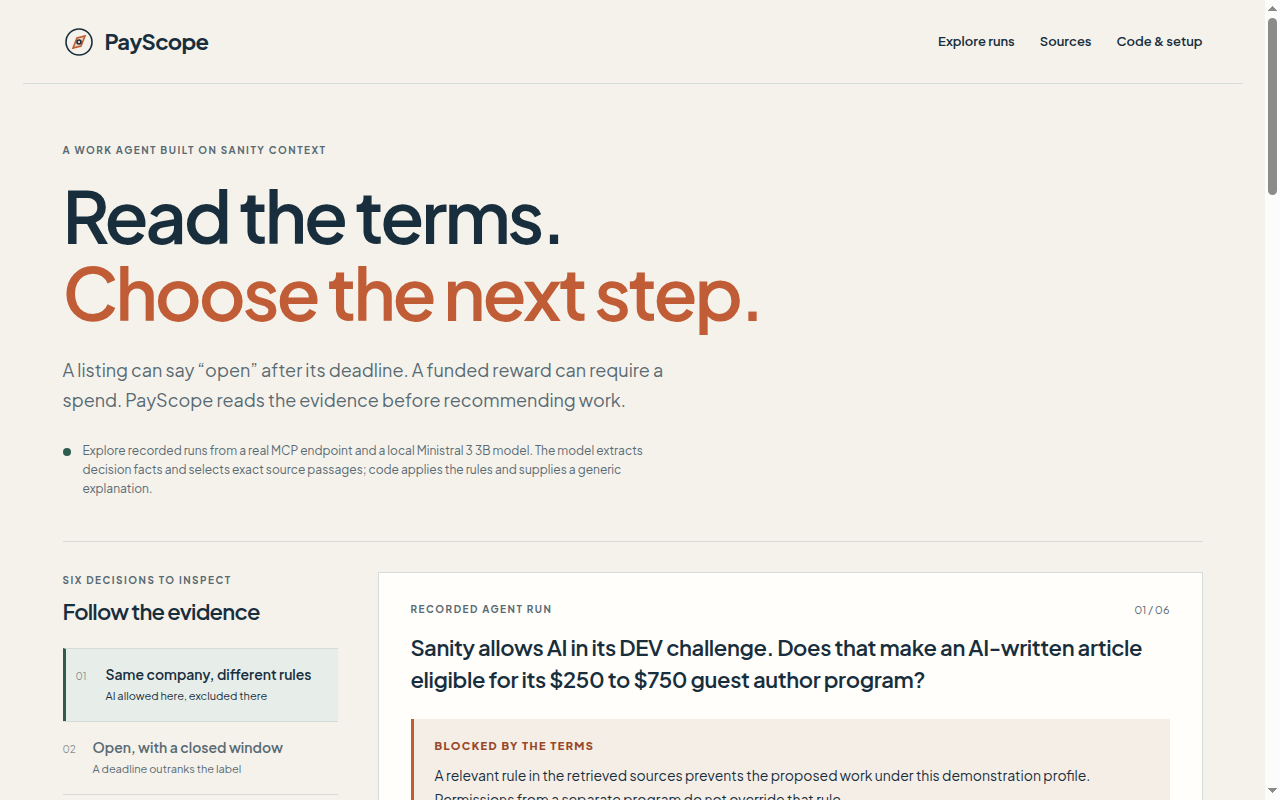 PayScope: read the terms, choose the next step
Source: Dev.to AI
PayScope: read the terms, choose the next step
Source: Dev.to AI
Data is useless if it isn't actionable. In 2026, developers are moving away from heavy, boilerplate-ridden charting libraries. shadcn/ui charts (built on top of Recharts) have become the gold standard for Next.js applications because they offer clean, accessible, and highly customizable components.
shadcn/ui is a collection of re-usable components that you can copy and paste into your apps, providing a bridge between raw data and beautiful, accessible user interfaces.
Tutorial: Adding a Performance Chart to Your Dashboard
To begin, ensure your Next.js 15+ environment is ready. We will use the shadcn CLI to add a chart component that visualizes our AI agent's performance.
1. Installation
npx shadcn@latest add chart
2. Defining the Data Structure
In 2026, we prefer typed data to ensure our AI agents can feed information directly into the UI.
const chartData = [
  { month: "January", productivity: 186, ai_efficiency: 80 },
  { month: "February", productivity: 305, ai_efficiency: 200 },
  { month: "March", productivity: 237, ai_efficiency: 120 },
];

const chartConfig = {
  productivity: {
    label: "Human Output",
    color: "#2563eb",
  },
  ai_efficiency: {
    label: "Agentic Output",
    color: "#60a5fa",
  },
} satisfies ChartConfig;
3. Creating the Component
Using shadcn, you can create a LineChart that is responsive and supports dark mode out of the box.
import { ChartContainer, ChartTooltip } from "@/components/ui/chart"
import { LineChart, Line, XAxis, CartesianGrid } from "recharts"

export function DashboardChart() {
  return (
    <ChartContainer config={chartConfig} className="min-h-[200px] w-full">
      <LineChart data={chartData}>
        <CartesianGrid vertical={false} />
        <XAxis
          dataKey="month"
          tickLine={false}
          axisLine={false}
          tickMargin={8}
        />
        <ChartTooltip />
        <Line dataKey="productivity" type="monotone" stroke="var(--color-productivity)" strokeWidth={2} />
        <Line dataKey="ai_efficiency" type="monotone" stroke="var(--color-ai_efficiency)" strokeWidth={2} />
      </LineChart>
    </ChartContainer>
  )
}
Section 4: Advanced Strategy - Orchestrating the Full Stack
To truly unlock peak performance, you must connect the Intelligence Layer (Agents) with the Visual Layer (shadcn).
The Workflow:
- Data Ingestion: Your AI Agent (integrated via Google Workspace APIs) scans your internal documents.
- Decision Making: The agent uses logic (like PayScope) to categorize tasks by priority and risk.
- Visualization: The results are pushed to a Next.js dashboard where shadcn charts provide an immediate visual breakdown of business health.
Abo-Elmakarem Shohoud emphasizes that the "Human-in-the-loop" remains critical. The dashboard shouldn't just show data; it should provide a "Next Step" recommendation based on the agent's findings.
Exercise: Try It Yourself
- Task: Create a simple JSON structure for an AI agent that monitors your email for "Invoices."
- Challenge: Use the logic from the PayScope model to identify if the invoice matches a pre-approved budget in your Google Sheets. If it doesn't, have the agent flag it for manual review on your shadcn dashboard.
Key Takeaways for 2026
- Proactive over Reactive: Shift your AI strategy from answering questions to executing goals autonomously within Google Workspace.
- Terms Matter: Implement "Agentic Reasoning" that reads the fine print of contracts and terms to prevent business errors.
- Simplify the UI: Use shadcn/ui charts to eliminate Recharts boilerplate, allowing your team to focus on data insights rather than CSS debugging.
- Unify Your Stack: Ensure your AI agents, mobile tools, and web dashboards share a single source of truth for maximum efficiency.
Next Steps for Further Learning
- Explore the Ailigent repository for advanced Agentic AI templates.
- Deep dive into the shadcn/ui documentation specifically for the new 2026 interactive chart features.
- Experiment with the Google Workspace Sidekick API to build custom mobile triggers for your agents.
By staying ahead of these trends, you ensure that your organization doesn't just survive in 2026 but thrives at the peak of technological performance.
Related Videos
Let's Use ShadcnDashboard.dev MCP Server | Install UI Block & Components Using Code Editor's
Channel: Shadcn Dashboard
Top 5 Claude Skills That can save 10x Your AI Sessions
Channel: Nick Automates